


En español, en français, em português.
Twenty years ago, net rates (without any cost or commission) were the norm, and hotels knew the profitability of each of their channels perfectly well. It was just a couple of clicks away in their PMS. What hotels did not know, though, was the retail price their properties were being sold for or how much guests were paying for the room. Therefore, hotels blissfully ignored the money they were leaving on the table that tour operators and agencies were taking.
Today, the picture is very different. Although some channels still pay net rates to hotels, such as Expedia’s merchant model, a majority of online channels use commissionable gross rates. With that shift, hotels and OTAs captured much of the business tour operators and agencies once had. On the way, however, hotels lost control of the most important KPI: net ADR.
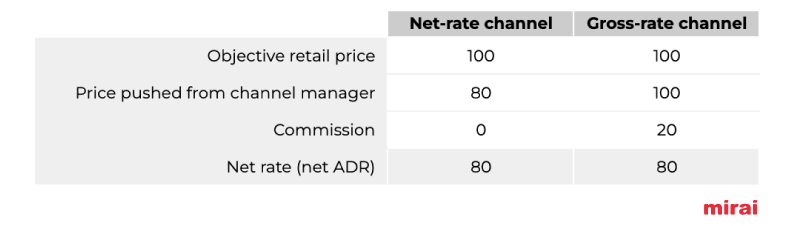
At first glance, it sounded like a major win with an acceptable toll. And it was. To get the net ADR, hotels simply discounted the commission and that was it. It wasn’t as easy and automatic as it used to be, but it was easy nonetheless.
Unfortunately, new discounts and costs (commissions, marketing and financial) turned that simplicity into a much harder, manual and error prone task. Even today, a majority of hotels ignore how much money they make (and lose) by channel. The difficulty of calculating the net ADR, together with the lack of automation in the PMS industry and RevPAR obsession, pushed the hotel industry to set a new KPI for profitability: “the average commission”. A much easier to estimate KPI but a totally misleading one, with negative consequences leading revenue managers to make wrong decisions such as:
- Favoring channels that appear to be “cheaper” but actually have among the lowest net ADRs in the channel mix. Booking.com is the most relevant example.
- Accepting, without a doubt, every new trick OTAs put on the table. Initiatives that always bear additional discounts or costs, putting more pressure on your already low net ADR.
- Even driving direct bookings thinking it’s the most efficient channel which it is in most of the cases. However, if done incorrectly, it may not be.
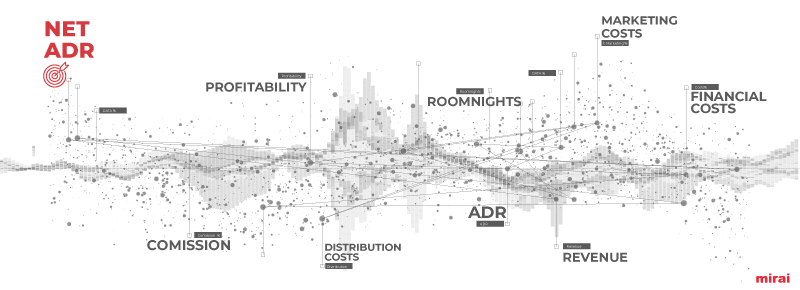
A rigorous net ADR analysis, that moves beyond “average commissions”, and that also takes into account discounts and all types of costs, is a core competency every professional revenue manager should have. Such a net ADR analysis should be in the ongoing to-do list of every hotel.
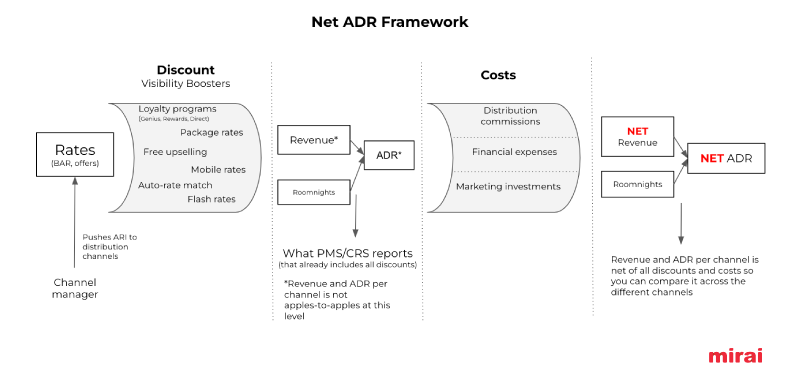
Visibility boosters
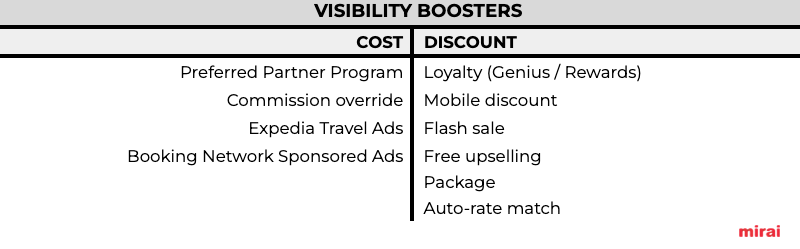
In the last decade, OTAs have been very successful introducing the idea that “visibility” had a “toll”. If you wanted to show up in the top positions in an OTA, you needed to give something in exchange. Many programs with fancy names emerged: Booking.com Preferred Partner, Genius and Booking Network Sponsored Ads, Expedia Rewards and Travel Ads, mobile discounts and flash sales are just a few examples. Hotels overwhelmingly embraced not just one option but many of them (and even simultaneously) yearning for that promised “incremental visibility”. While doing so, not only did they lose control of their asking retail price but they also lost control of the costs they were paying the OTAs. As a result, net ADRs plummeted without many even realizing.
We can divide visibility boosters in two types:
- “Cost boosters”: hotels pay more to the OTA (higher commission or other fees).
- “Discount boosters”: hotels discount their rate but pay the same commission.
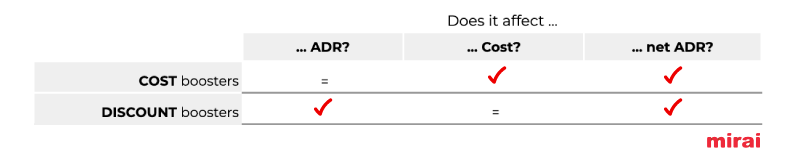
Both boosters (cost and discount) negatively impact the profitability of the hotel (net ADR). In a different way, though. Whereas cost boosters impact the “commission or cost”, discount boosters push the ADR down. What matters is that net ADR is always impacted.
We can see the impact in a simple example:
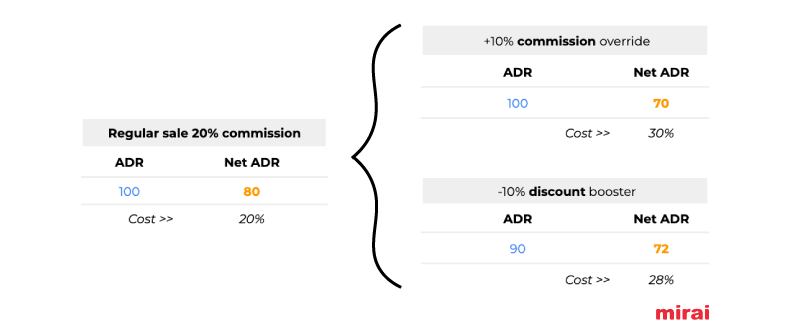
Despite a similar negative impact on profitability, discount boosters are better perceived by the hotel industry than cost ones because:
- They don’t increase the “cost” or “commission”, the new and misleading KPI for profitability.
- Revenue managers can decide to discount the rate but do not always have the autonomy to increase the channel cost. To do so, they sometimes need a third party approval.
Distribution, financial and marketing costs
A classical error when assessing the profitability of a channel is considering the commission as the only cost. Unfortunately, there are more types of cost hotels rarely take into account in their analysis.
Distribution cost: the commission paid to the channel for the generated bookings. Some notes to remember when calculating the cost of each channel:
- Taxes: some channels apply the commission over the final retail price including taxes, which is insane, but the hotel industry surprisingly accepted that.
- Resort fee: again some channels apply commission over the resort fee and others don’t.
- B2B and tour operators: some distribution costs are not paid on every booking but at the end of the year should some revenue objectives have been met. If this is your case, you should consider this extra commission in your analysis.
Financial costs: the cost you have to pay to get the revenue.
- For bookings with “direct payment at the hotel”, the cost varies from 0.5%-1% in Europe to 3% in America.
- For OTAs that pay you with a VCC (virtual credit card), the financial cost you bear is between 3% and 3.5%. Booking.com and Expedia mostly pay using VCC, although both offer the alternative of “wire transfer” to some clients.
Marketing costs: the investment hotels make to promote their properties within each channel.
- OTA marketing: the two most known are Expedia Travel Ads and Booking Network Sponsored Ads. Both work on a CPC or cost per click model.
- Direct marketing: lots of different initiatives to boost direct sales. You have to include here Google Ads, metasearch investment, display, retargeting or email marketing campaigns. Every marketing spend either in commission model or cost per click should be considered. You can find here a complete list of how much the direct channel costs.
- B2B and tour operators: still some channels ask for marketing investments oriented to print brochures and leaflets. Most (if not all) this money goes to online advertising. Whatever is your case, don’t forget to attribute these costs to the proper channels.
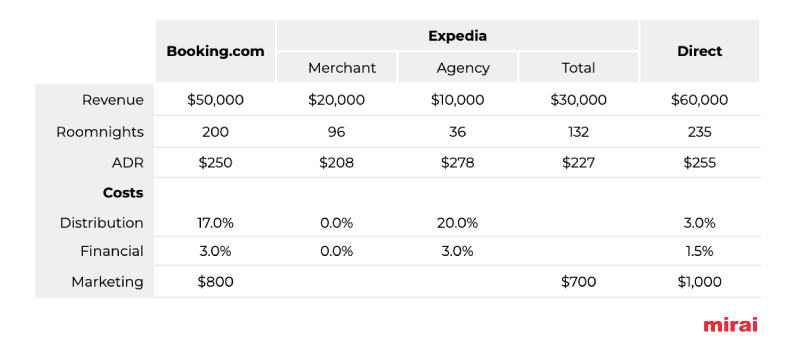
Let’s work with a couple of examples with the largest OTAs and any given month. You should be able to get this information pretty easily.
Important to point out that the following example is a made up one. We assumed some commissions, marketing investments and financial costs, such as VCC for Booking.com and Expedia agency model, whereas zero cost for Expedia merchant assuming wire transfers. You have to get your own numbers.
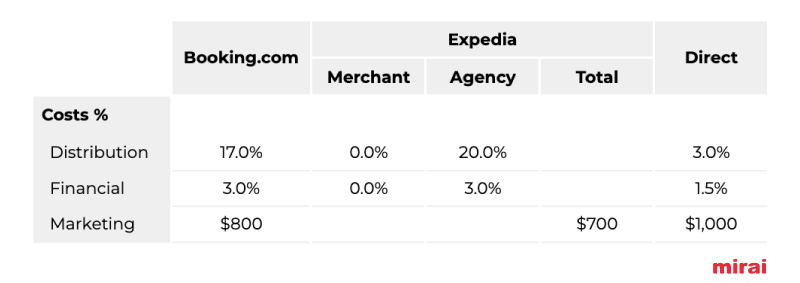
Although a good cost analysis is an essential part, it’s not enough to know what channel is more efficient. If we only see the costs, it looks like Expedia’s merchant model is the most efficient, when we all know that’s not the case.
Getting the net ADR by channel: how to reconcile net/gross rates, discounts and the three types of costs
First set the time frame you want your analysis to be made. It can be one month, several or an entire year. Always by staydate or checkoutdate (not by booking date).
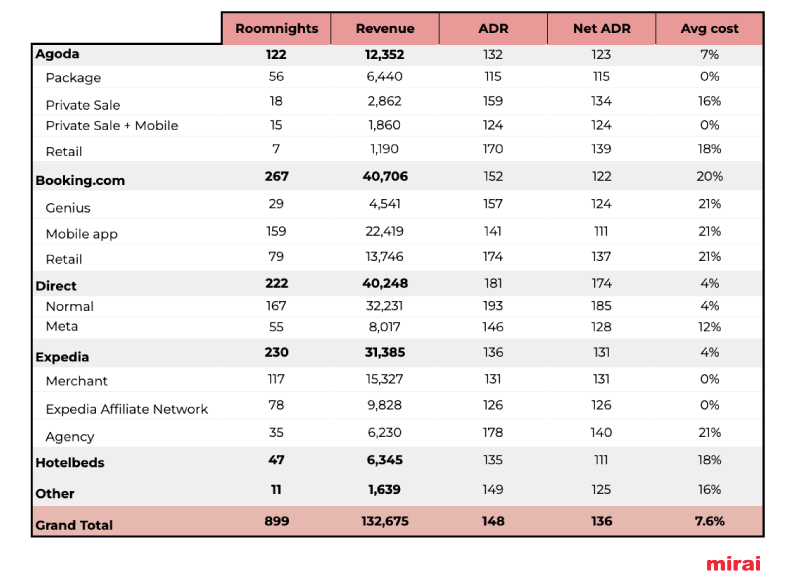
Your first stop is your CRS or PMS. You should get the revenue and number of roomnights by channel. All your discount visibility boosters have already impacted your revenue and ADR, as they discounted the rate in the first place. If your PMS/CRS does not have this information per channel, you may need to access the extranet of the OTAs too. We’ll continue with our previous example and will use blue to highlight the numbers we are adding to the model.
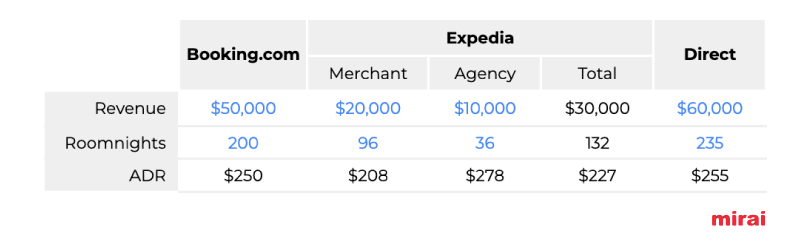
A first conclusion is that the ADR in your PMS/CRS is not an “apples to apples” KPI as it is mixing net and gross rates. If you are getting your RevPAR from this ADR, your analysis has a tremendous bias in favor of gross channels. Another variable that can affect the ADR of each channel is the roomtype and occupancy segmentation of the revenue. Let’s assume for this exercise, that all channels sell all room types. If this is not the case, we should need to incorporate that differentiation in the analysis.
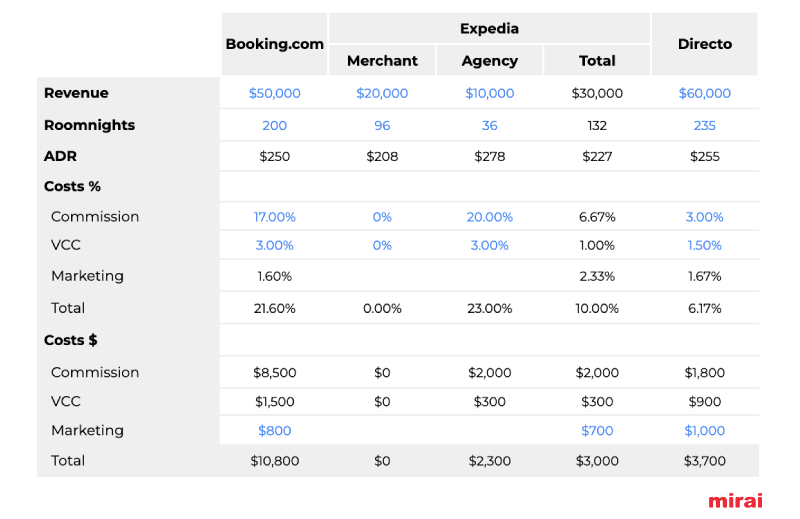
It’s time to plug your costs (the three types) into your framework. Each channel’s costs with their revenue and roomnights.
Since there are costs already in commission but others in dollar value, you’ll need to make some adjustments. Not a big deal, though. Just separate costs in % and $ to have a brighter picture. Numbers in blue are again your inputs to the model.
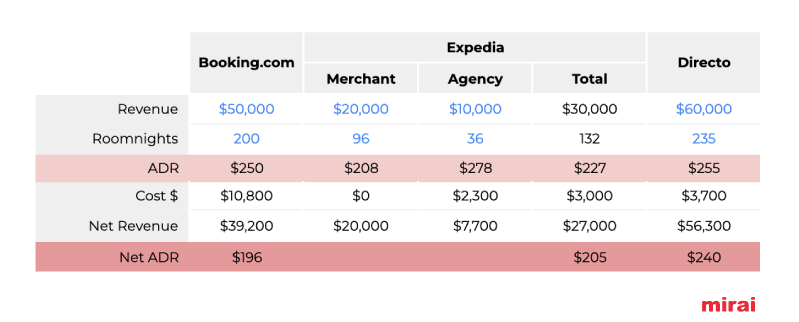
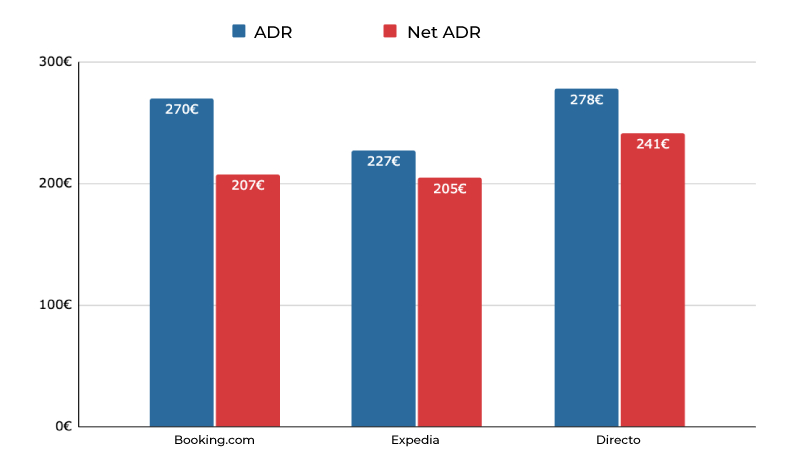
And we’re one step away from our net ADR goal. Since we have the cost in $, let’s calculate the net revenue and net ADR. Now we are in a position of telling what channel generates more net contribution to your hotel. In our example, Expedia has a lower net ADR, which would indicate that it is a less efficient channel. In our experience with these analyses, sometimes Booking.com is less efficient and sometimes Expedia. You have to make your own numbers so don’t go by this example or generalize.
If you would like a template for your own analysis, please ask for it by filling out this form. Remember you have to enter your own data in the cells with numbers in blue.
Endless variables and segments to analyze
The above analysis covers the basics, which is the direct channel as well as the two largest OTAs in the world, splitting Expedia in merchant and agency. However, you can break down any channel in all the segments you can track down.
Wouldn’t it be great to know your Booking.com revenue broken down by mobile and Genius rates? How about understanding the profitability of all Expedia’s affiliate channels (Expedia.com, Hotels.com, Orbitz.com or the black hole of EAN or Expedia Affiliate Network)? Maybe this information helps you revisit your strategy of participating in all these programs and visibility boosters such as Genius? Regarding the direct, why not break your revenues down into regular, metasearch or loyalty? Once you can get the revenue and roomnights of each group there is no limit in your analysis.
Wouldn’t it be great to have this analysis every month? Or every quarter? Or per year? You can certainly do it. It’s a matter of understanding where to start and what steps to follow.
Conclusion
The high complexity in the current distribution ecosystem has led the hotel to guesstimate what the costs and profitability of each channel is. However, this analysis tends to be poor, based on many assumptions and incomplete as it does not incorporate all discounts and costs. Low level of PMS/CRS automation and a lack of the right incentives to revenue managers (to make money on net RevPAR instead of just RevPAR) make the rest. As a result, OTAs are capturing more and more market share by adding more “visibility boosters” that many revenue managers accept without much hesitation. OTAs efficiency is far from what they claim it to be and significantly drags down margins of the entire hotel industry.
The good news is that the solution is right in front of hotels. It’s as simple as changing the lens to assess channel profitability, moving away from “average commission” and adopting “net ADR”. Once a net ADR framework is in place and it becomes rooted in the company’s DNA, hotels will find a great and untapped opportunity to increase their GOP without altering the top line or revenue.
A final note
Would you be interested in Mirai doing this net ADR analysis or helping you implement such a framework in your organization, just let us know. It’s one of the many services we provide to hotels in our Mirai Distribution Consulting division.