


En español, en français, em português.
Understanding whether your direct channel is performing poorly, averagely or stellarly is not as easy as you may think. There is actually a gap between perception and reality, with many hotels thinking they are doing great, when they are not, and vice versa. This misjudgement is potentially a major problem as it leads hotels to make wrong decisions, making the problem even bigger.

Direct revenue as a percentage of the total, a good KPI but not enough
Measuring your direct web revenue as a percentage of the total revenue has become a standard in the hotel industry. It is mathematically correct and a piece of information accessible from any decent PMS. It is also easy to understand and compare year over year. Many advantages that made this KPI very popular among sales and marketing managers. However, is it enough to answer the following questions?
- Is your 20% direct share a good or bad number?
- Should you be happy because your direct share reached 25% when it was 20% last year?
- Does your 25% share mean you’re doing better than another hotel making 20%?
If you are answering all these questions right away, chances are that you’ll be wrong. The only correct response is “it depends”. And what does it depend on? To give a precise answer we need information from all other channels, not just the direct. That extra information will add the necessary context you missed before.
Additionally, we need a framework that will allow us to see the picture we are looking for and get to the right conclusions. Let’s see how to get it.
Offline segments and tour operation
Offline segments such as groups, MICE and corporate, play a very important role in the distribution of many hotels. These segments fill many of the rooms, highly reducing the inventory for the rest of the segments to sell. Effectively, it’s like if you have a much smaller hotel to sell online.
The same happens with tour operators, traditionally offline channels that actually sell most of their rooms online. Many tour operators still enjoy exclusive conditions such as room allotments and fixed prices set months ahead. Very few accept dynamic prices from your channel manager or CRS. Can you imagine a yieldable channel (such as OTAs and your direct) competing with tour operators that enjoy these many advantages? It is not a fair competition.
In hotels with such strong segments/channels, we need an additional KPI to measure the direct channel’s performance. We need a way to measure it relative only to inventory it has a real chance to sell.
Direct revenue as a percentage of the online revenue (yieldable channels)
By excluding the rooms that your direct channel has no or very little chance of selling, we get a much more precise number that will tell us whether we are doing good or bad with our direct channel.
With that objective in mind, let’s roll up our shirts and dive into the numbers.
- Go to the most reliable source of information in your hotel. That could be the PMS, CRS or even your channel manager.
- Select a time frame. It can be one month, a quarter or the last twelve months. The more historical data, the better.
- Choose between “stay date” or “booking date”. Each option would give you a different angle. Whereas “stay date” is an aggregated and historical view, “booking date” gives you a forward-looking view and would immediately reflect sudden changes on your channel mix.
- Get the number of bookings, roomnights and revenue information per channel per month for that time frame. Write everything down into a simple spreadsheet model.
- Identify channels your website can compete with. That is, by default, all channels that are yieldable and accept dynamic inventory/price changes. Remove the rest (we already discussed this: MICE, groups, corporate, tour operators, GDS, etc). Exclude also other forms of direct such as contact center or walk-ins. Keep bed banks/wholesalers, as most of their bookings are online (although they tell you otherwise).
- Use gross revenue or net revenue but never mix them. Some channels report their revenue “net” (wholesalers and merchant OTAs such as Agoda, Airbnb or Expedia Collect), whereas other channels report their revenue “gross” such as agency model OTAs (Booking.com, Expedia in Hotel Collect, and most direct booking engines). Additionally, make sure taxes are included or excluded but never mix different concepts either. Alternatively, just use roomnights instead of revenue for your math. You’ll get to similar conclusions and it’s much easier to.
- Your spreadsheet now should look like this (using roomnights in this example instead of revenue).
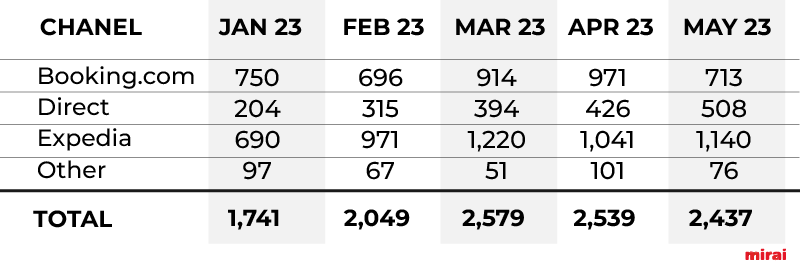
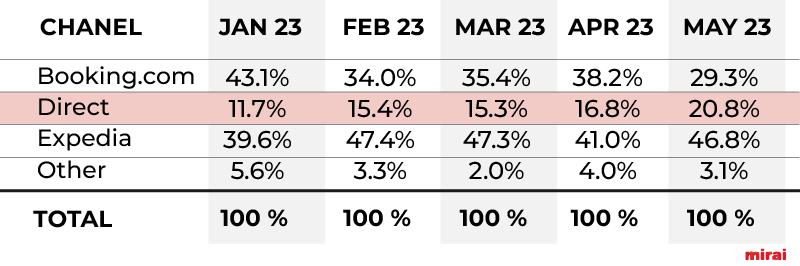
- Calculate the share of each channel out of the sub-total (not total as we removed offline channels). You would get something like this.
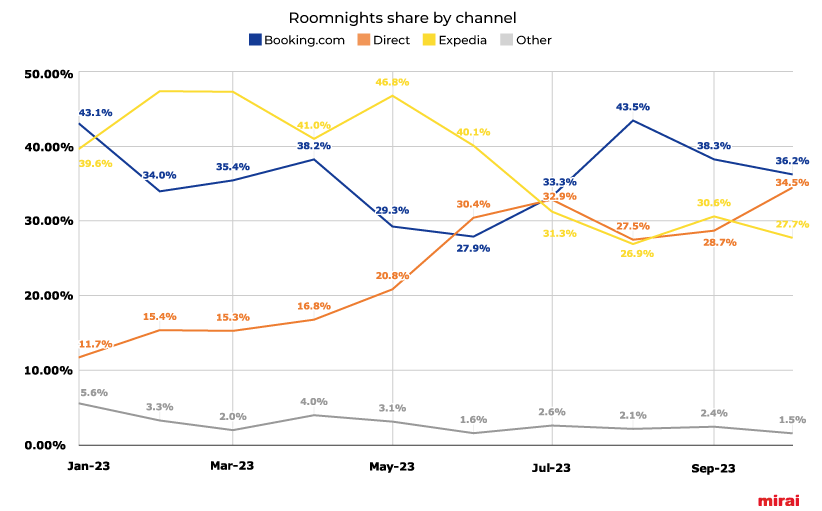
- A graph format works better to present and understand the data.
- Regularly update the data to keep track of your performance over time.
Ready to understand how your direct channel is doing
We have the two KPIs we need to assess your direct channel performance.
- Direct revenue out of the total revenue of your hotel.
- Direct revenue out of exclusively yieldable and online channels.
Let’s combine these two numbers and get the clean picture we need.
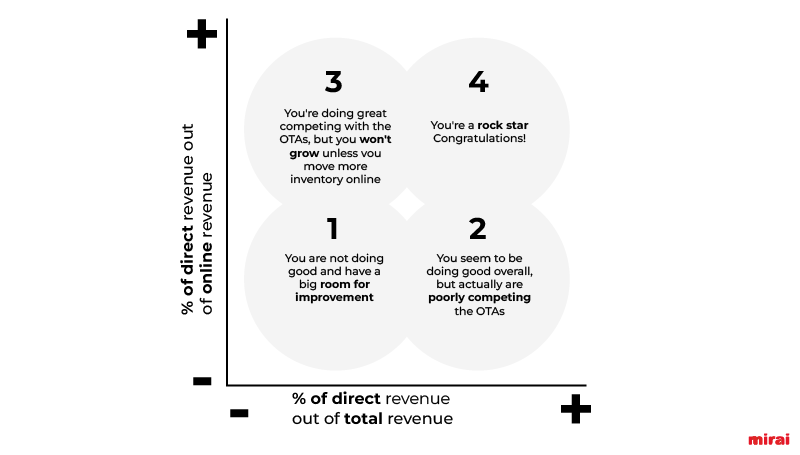
These are the characteristics of each quadrant:
Hotels in this quadrant |
Assessment |
Growth path |
|
1
|
Direct share around 10% increasing to 15% when compared to online channels.These numbers are typically found in hotels that haven’t updated their distribution strategy and don’t understand how the online ecosystem works. |
You are selling a majority of your rooms through offline segments/channels and, within those rooms you sell online, the OTAs are clearly beating you. |
Moving rooms from offline to online channels and reconsidering your direct online strategy as it’s clearly not working |
2 |
Direct share around 30% and 32% compared to online channels.These numbers are more likely to be found in mid-sized to small hotels with a high share of leisure and mostly distributed online. |
A great signal to have a high overall number. However, don’t let this number mislead you.OTAs are doing better than you. |
Question your existing online direct strategy as it’s not performing as you would like. |
3 |
Direct share around 10% but grows up to 50%-60% compared to online channels.These numbers are found in hotels selling most of their inventory through non-yieldable channels (MICE, groups, corporate or non-yieldable tour operators), but still have a high level of online sophistication and knowledge. |
Your direct overall share is low, but don’t let this number fool you as your direct channel is capturing a majority of what it can potentially sell.You’re actually doing a great job competing head to head with the OTAs or even beating them. |
Moving rooms from offline to yieldable channels. There is very little or no room to drive away more rooms from the OTAs as you would be at risk of losing visibility. |
4 |
Direct share is more than 40% and 50%-60% compared to online channels. |
You’re definitely a rock star. Congratulations. |
Concentrate on keeping these numbers. Boosting loyalty would definitely help you keep slowly improving your ratios. |
Moves between quadrants
Once we understand where we are, we just need to monitor how our direct channel performance evolves over time. Remember any decision by you or your distribution channels may impact your current performance.
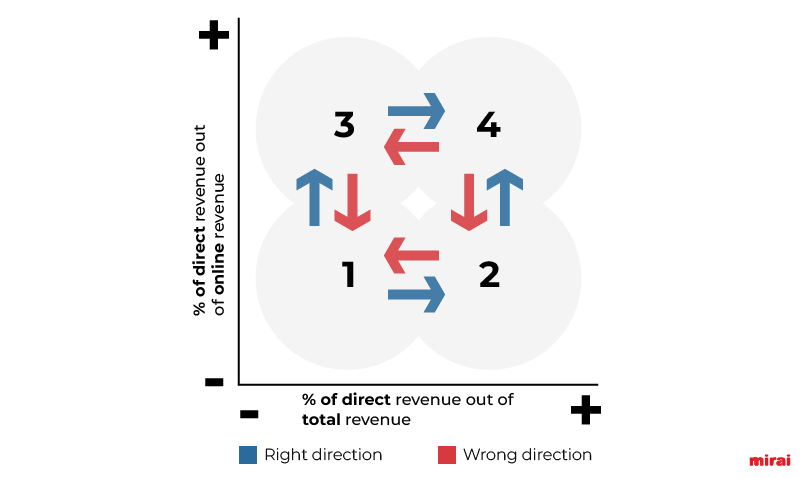
Some examples that will help your direct channel move in the right direction:
- Improving the design and performance of your website.
- Investing in a good and conversion oriented booking engine.
- Adding a true value proposition of booking directly such as exclusive room types, better cancellation policies and, of course, offering a better price directly.
- Starting investing in metasearch or Google Ads to capture back the first positions in search engines.
- Implementing a loyalty program on your direct site to offer your customers the best prices and conditions.
These other examples would actually do the opposite:
- Allowing OTA and wholesaler channels to undercut you.
- Joining any OTAs’ loyalty program (Booking Genius or Expedia Rewards), implement their visibility boosters without an analytical approach or activating their mobile rates.
- Signing a new tour operation contract in a top market and not having it connected to your channel manager.
- Replacing your booking engine with a worse one to reduce your costs (which most of the times ends up with a higher cost but on the OTAs side)
- Stop investing in online digital marketing while allowing OTAs to bid on your name and brand.
Conclusion
Wrong decisions are typically the outcome of basing your decisions on wrong or inaccurate data. This is actually what is happening to hotels that exclusively consider the “share of direct channel out of the total revenue” as the only KPI to understand how their direct channel is doing.
The good news is that completing the picture you need with a second KPI (“share of direct channel out of your online revenue”) is quite easy and does not require sophistication. Just a spreadsheet, a simple framework and crunching some numbers every month.
From now on, any decision you make will immediately be reflected in your channel mix analysis. Reinforce those that move you in the right direction, and revert those others that do otherwise.
At Mirai Consulting, we assist hotels in conducting this analysis and provide them with the right decision-making support to ensure their direct sales progress in the right direction. If you want to learn more, reach out to our team of experts at consulting@mirai.com.