


En español, en français, em português.
Surely more than once you have seen how in the Google Hotel Ads results your direct prices were above all other channels. Can you imagine having detailed information on how often or when this happens, or even in which country it happens most regularly? This is exactly what we have done with this new tool, with which we extract the most relevant data from Google’s platform and integrate it into our BI. This new report will allow you to know the state of your prices in relation to those offered by the other distributors of your product.
What can you see and analyse in this report?
You will have access to the key performance indicators (KPIs) of searches performed on Google Hotel Ads (GHA) over the last 7 days for any future stay date:
- Total impressions of your hotel (the number of times it has appeared in an end customer’s search results, be it through your direct channel or through an intermediary)
- Impressions featuring your direct sales
- IS%: Impression Share or the percentage of the total amount of impressions corresponding to your hotel (the closer to 100, the better)
- Lose: Number of times a distributor had a better price than you
- %Lose: Percentage of times your hotel has been listed on Google but the price on your website was not competitive
- %Diff: Percentage of average price difference compared to the best available price
- Clicks: Number of clicks you have received (this should be similar to your visits received)
- CTR%: Percentage of clicks in relation to the number of times your website has been shown
In the report, we condense all this information in the most manageable way possible, the goal being to make it easier for you to find the most demanded and least competitively priced dates, as well as the markets where they appear. At first glance, it may seem complex and overloaded with information, but let’s look at the different sections and how we can use them to our advantage:
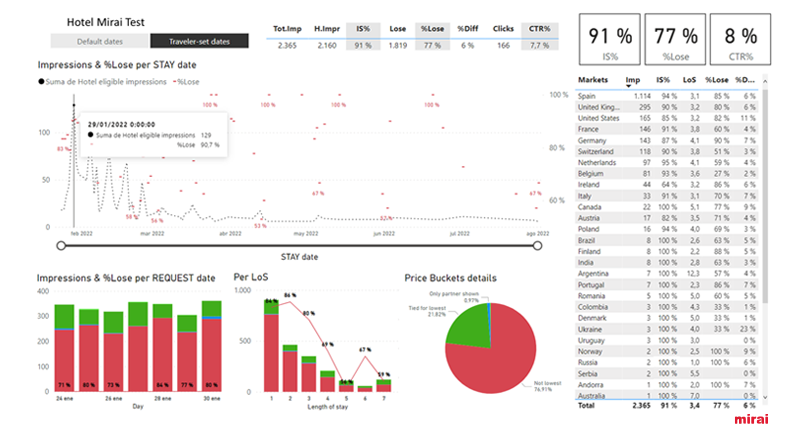
Let’s take it one step at a time
The first section of the report helps us separate the metrics having to do to user activity (traveller set dates) from those having to do with what Google presents by default (default dates) in an endless array of different use cases, just like any search related to your hotel. We know that data derived from the interaction of an end-user is of much greater value, which is why we select it by default in the following way:
Next to this selector, still in the upper section, we find a summary of the main KPIs:
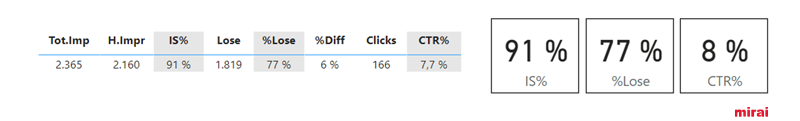
We have already mentioned them in the article’s introduction, but we now want to highlight and expand on some of them:
- IS%: Impression Share
The closer to 100%, the better, as we will be maximising the number of times our website appears.
- % Lose: Percentage of uncompetitive prices
The smaller the better. 0% means that no one EVER has a better price than us. In other words, we would ALWAYS get the best price.
- CTR%: Click Through Rate
The higher the better. Indicates the attractiveness of our advertisement.
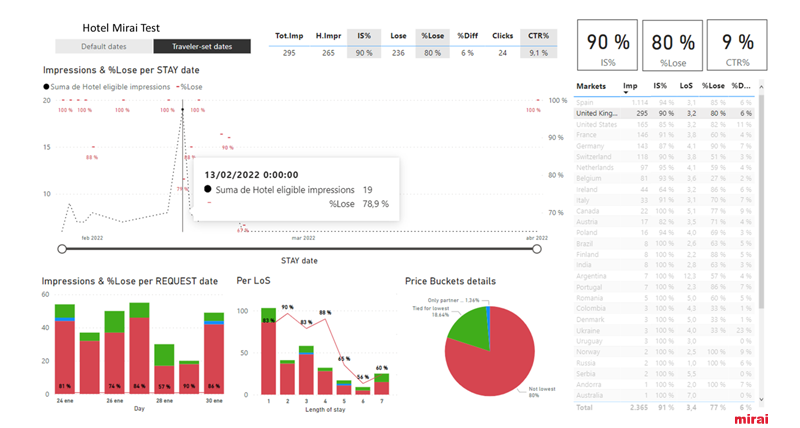
In the main section of the report, you can see the dates of future stay that Google users are selecting, as well as the percentage of times you are not competitive:
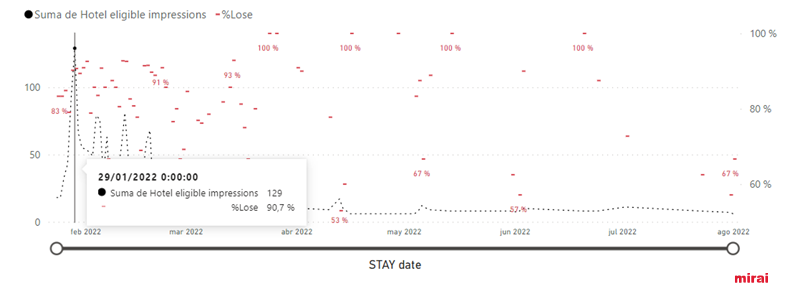
In this example you can see how on 29/01/22 there are quite a few impressions (times your hotel has appeared on Google pages) and that in the vast majority of cases (90.7%) you did NOT have a competitive price. Now we just need to know in which markets this is happening. You can see this in the table below, which gives you all the relevant details per market, including the average length of stay (LoS) that users are requesting:
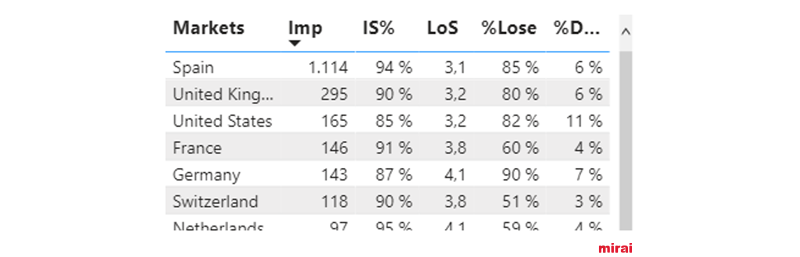
In this example, the US stands out for its large average price difference (11%) and Germany for having the highest %Lose (90%, a bad figure), almost twice as much as its neighbour Switzerland (50%, not so bad). The information in this table can also help you to better understand your hotel’s online demand and discover markets that you may not have been considering in your online distribution strategy.
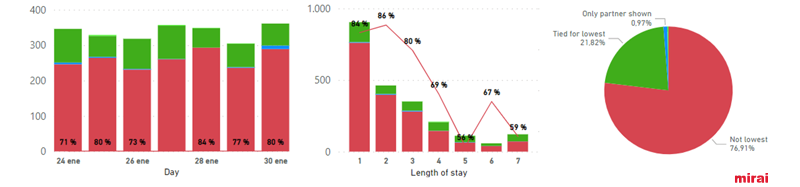
Lastly, at the bottom of the report we can see the evolution of the number of impressions per day of performance, as well as the average length of stay (LoS) with the details of each type of competitiveness situation, as defined by Google:
- Not lowest (Lose) (red): Your price is not within 2% of the lowest price shown (2% is the threshold that Google uses)
- Only partner shown (blue): The perfect situation. Your price is the only one that appears
- Tied for lowest (green): You’re within the lowest price but there are one or more advertisers as well. All channels at parity
- Uniquely lowest (fluorescent green): Your site has the lowest price with a difference of more than 2% over your immediate competitor
And finally, we’d like to underscore that all our reports are dynamic and allow for cross-filtering between all components of the report. By clicking on any item in any chart or table, the rest of the report adapts, displaying data with that item filtered. For example, if we want to better understand what is happening in the UK, we click on that item in the market table on the right and see how the rest of the report adapts to show the data for that market:
You will find our new “Competitiveness Report” on our extranet in the section Reports > BI, under the tab “GHA”.
Mirai’s BI, an extra benefit of working with our booking engine and a powerful tool that brings you:
- The most comprehensive upselling reports available in BI
- More information, easier access and better organised
- New web demand report in our BI
- You can choose which year you compare your data with: -1, -2 or -3
- Price competitiveness in Hotel Ads, as shown in this post.
- Reporting of all your marketing investments (Ads and metasearch).
- Benchmark of similar clients
- Type of stay, occupancy, Club, etc. as well as data analytics: general situation of your hotel, On the books (OTB), Pickup, Markets…
- Mirai BI recull la informació de Mirai Rescue: Wait List, Cart Recovery i Retargeting
Get the most out of this report and make your direct sales more competitive! Your account manager can help you if you have any questions.