


En español, en français, em português.
Before the summer, we enhanced our BI solution with more insights and new views to make the most of key direct selling data. Now, we complete it with the possibility of comparing your hotel with a group of similar hotels (compset or bench).
Sometimes your absolute data doesn’t give you the complete answers you need and the best way to get them requires comparing them with a reference, which in this case would be a group of hotels similar to yours. If this comparison is complete, you can find specific aspects where you have the potential for improvement and focus on the priorities.
How do we do it?
- We search for the most similar hotels (at least 5) among our current clients (~2,000 hotels), looking at various factors such as their location, stars, property type…
- We aggregate/ normalise their data so that we can properly compare with your hotel.
- We create a report to analyse any past reservation period and compare key data (revenue, room nights, reservations and average rate). You can also cross-filter between all the report’s elements, so that you can view it by week of completion, month of stay, market, board or type of stay (duration).
Below, we analyse a real and current example of a city hotel that would look like this:
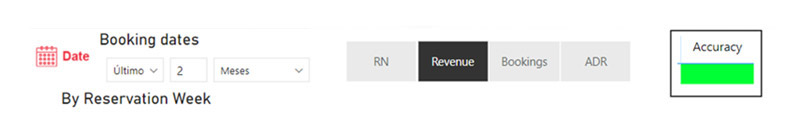
Filter the dates and variables you want to analyse
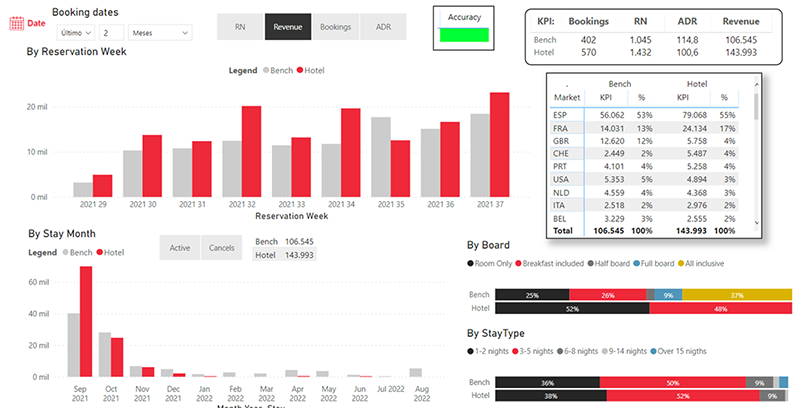
Easily select the booking period to analyse and the metric to compare on the main graphs (reservations, room nights, revenue or average rate). We will tell you the accuracy of the report (green indicates good level, amber is normal and red is bad), which depends on the number of similar hotels we find among current clients.
Summary of the main indicators always visible
At the top right, you will find a summary of your hotel’s main metrics compared to your compset or bench, which will give you a glimpse of your performance.

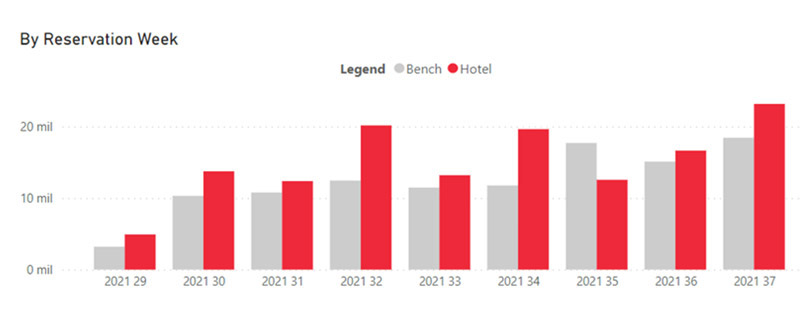
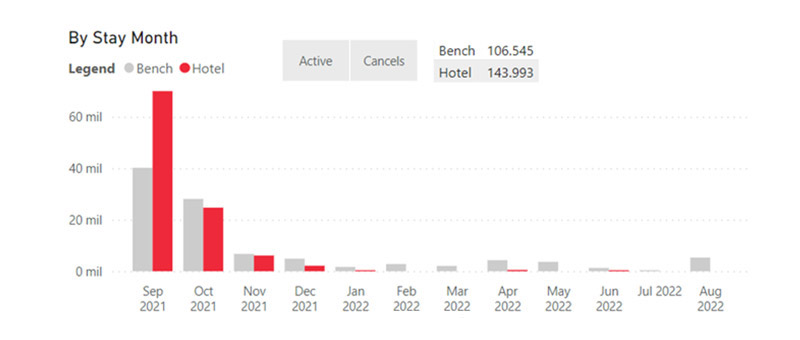
Analyse the results by reservation date and by date of stay
- By reservation date: You will find the comparison of your hotel and the bench by reservation week (pickup). The variable shown will be the one you previously chose in the filters.
- By date of stay: The most classic hotel view (OTB), where you will see yourself compared to your bench in the next 10 months being able to view or discount cancelled bookings, which will allow you to infer the cancellation that your bench is having too.
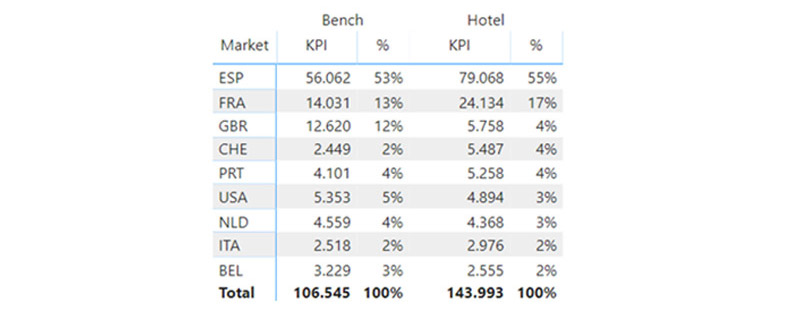
Find markets with potential
We show the KPI selected for each market, both the bench’s and hotel’s, sorted by weight. In this way, we can compare them and find cases with potential to explore. In this case, the bench has a lot more British (GBR) than our hotel, which indicates an opportunity to analyse…
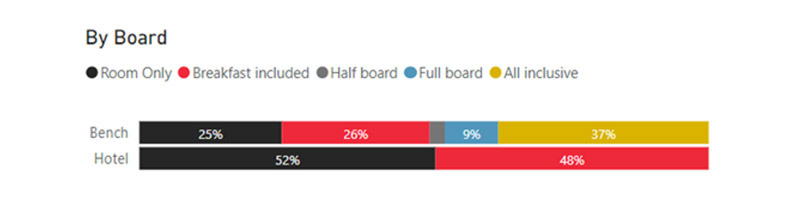
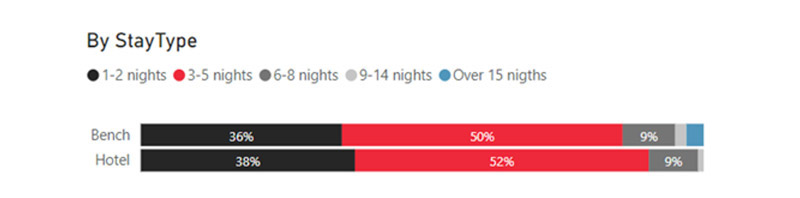
Analyse other relevant variables:
- Board, where you can compare the relevance of boards and see if you are missing one relevant to your bench:
- Length of stay, which allows you to check if you are aligned with the bench, as in this case, or if there are certain types of rooms with potential to analyse.
This benchmark tool, included for all our engine clients and accessible via extranet, is one of the ways we propose to detect opportunities for improvement, as we explained recently in another post. Take advantage of it!
Mirai’s BI, an extra benefit of working with our booking engine and a powerful tool that brings you:
- The most comprehensive upselling reports available in BI
- More information, easier access and better organised
- New web demand report in our BI
- You can choose which year you compare your data with: -1, -2 or -3
- Price competitiveness in Hotel Ads
- Reporting of all your marketing investments (Ads and metasearch).
- Benchmark of similar clients, as we show in this post.
- Type of stay, occupancy, Club, etc. as well as data analytics: general situation of your hotel, On the books (OTB), Pickup, Markets…
- Mirai BI collects the information from Mirai Rescue: Wait List, Cart Recovery and Retargeting
Get the most out of this report and make your direct sales more competitive! Your account manager can help you if you have any questions.