


En español, en français, em português.
At Mirai, we continue to enrich our BI solution with new improvements so that you can get the most out of your direct sales. And in this line we launch a new report so that you can observe and analyse the demand for reservations that you receive in your engine, the requests.
Your website traffic does not always represent the real demand and can distort your conversion results. The requests to the engine, however, provide very valuable quantitative and qualitative information that is worth analysing. Every time someone is really interested in your hotel, they search in detail what they are looking for (with dates of stay and occupations). Knowing this demand data will provide you with opportunities to optimise your results. At Mirai, we store that information, structure it, enrich it and load it into the BI so that you can make the most of it.
What can you see and analyse in this report?
We save each request with all its details:
- Request date
- Geographic origin of the request
- Dates (from – until)
- Number of rooms
- Occupation (adults and children)
And also the details of the responses to the customer at the RoomType level:
- Availability
- If denied, the reason why this request is rejected
- The above information allows us to calculate the %Denied (%Rejected), which would be one of the KPIs to monitor and minimise
As, in addition, we know the reservations that are being generated for those dates and their details, we can calculate 2 very relevant KPIs:
- % Conversion
- Lost revenue (estimated value of rejected requests)
In the report we condense all this information for the requests of the last week in the most usable way possible. The main goal is to make it easier for you to find the most demanded dates and where you are rejecting more requests, even estimating their value and opportunity cost, so that you can review the inventory and minimise rejection (potential sales). We also take the opportunity to compare conversion and rejection by market and by request profile. All this may seem complex and too much information, but let’s see it in parts:
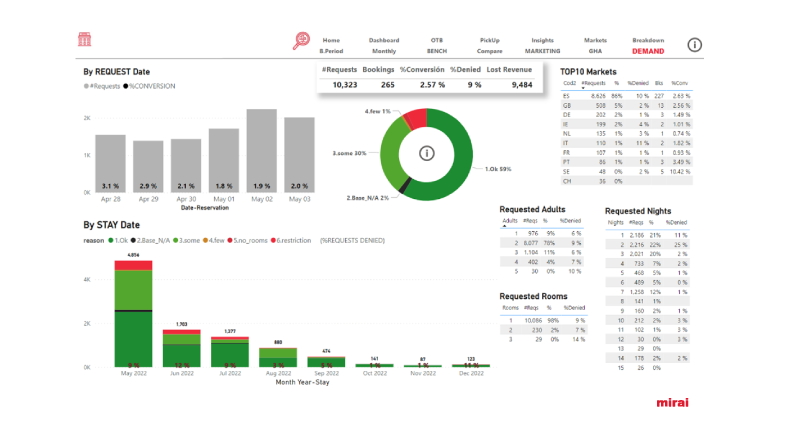
Two bar graphs are displayed:
- One by Request dates, where you can see the number of requests and the conversion for each day last week. The idea is to also add the history in a second phase (internally we already have it, so if you need it you can ask your account manager).
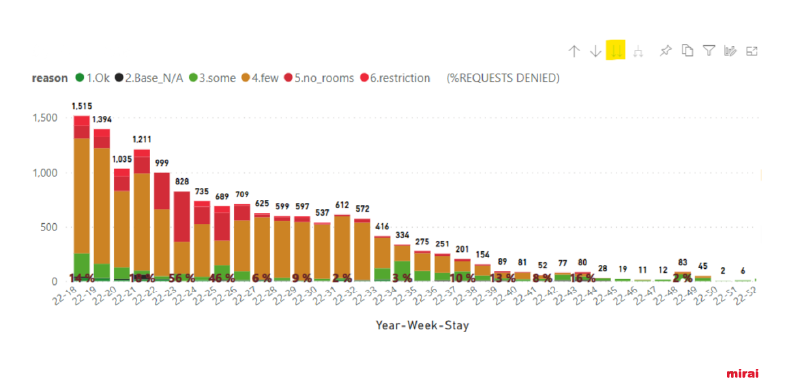
- The second has more to it. These are the months of stay demanded in the requests received. For each current or future month you can see the number of requests, broken down by the type of system response:
- Ok: All available RoomTypes
- Base_N/A: Base room not available
- Some: Most RoomTypes available
- Few: Most RoomTypes not available
- No Rooms: No RoomType available
- Restrictions: None of the restrictions are met.
The percentage of requests rejected (%Requests denied) for each month of stay is also indicated. And if you want to go deeper into the analysis, you can lower the graph to the level of the week of stay, by clicking on the icon with the two downward arrows:
A donut chart is also shown where you can see the proportion of response types that are being given to requests:

Finally we have the number tables. The first summarises the relevant KPIs: #Requests, Bookings, %Conversion (bookings / #requests), %Denied (percentage of requests denied or rejected) and the estimated revenues if you had not rejected any request.

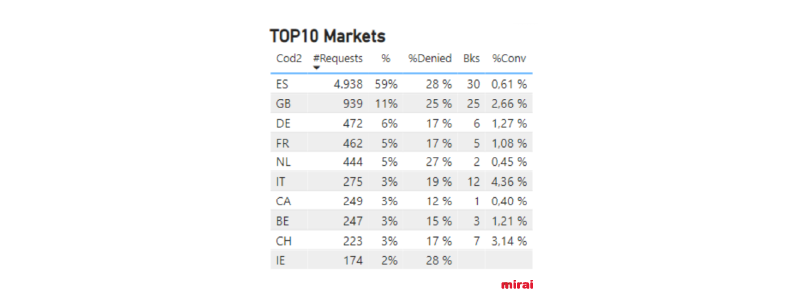
Additionally, there are several tables that allow you to break down and analyse the main KPIs. The most relevant is that of Markets, which also shows the conversion percentage for each of them (you should bear in mind that there are also requests from Bots that can lower these percentages in certain markets).
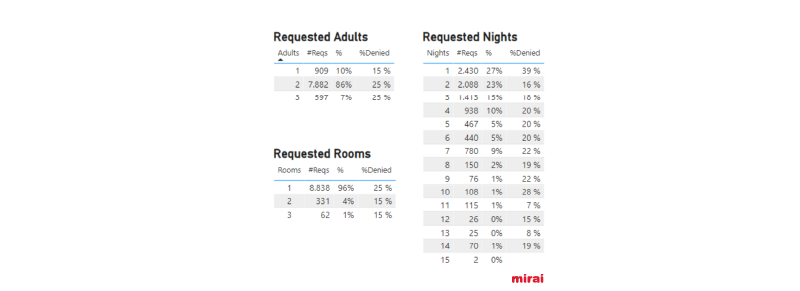
Finally, we have three tables with the breakdown by the number of nights, adults and rooms requested:
All this information is invaluable for making decisions to continue improving your direct sales. Make the most of it!
Other features of our BI tool:
- The most comprehensive upselling reports available in BI
- More information, easier access and better organised
- Possibility to compare vs 2021, 2020 or 2019
- Price competitiveness in Hotel Ads
- Reporting of all your marketing investments (Ads and metasearch)
- Benchmark of similar clients
- Type of stay, occupation ,Club, etc…as well as data analysis: general situation of your hotel, On the books (OTB), Pickup, Markets…
- Mirai BI collects the information from Mirai Rescue: Wait List, Cart Recovery and Retargeting
If you have any questions or need Mirai to explain more about our BI, ask your account manager.