En español, en francés, en portugués.
Introduction
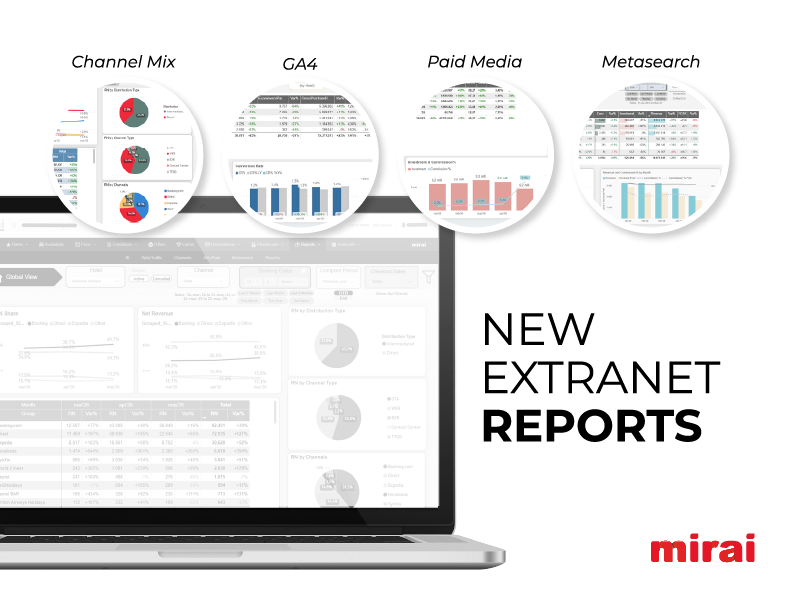
New reports are now available on the extranet to help you better understand your direct sales: distribution, web traffic, digital investment and meta-search engines, all presented in a more connected and decision-oriented format.
Which channels deliver the most real value? Where does demand drop off before a booking is made? Which investments help drive more direct sales? Am I competitive when customers compare prices? Now you can answer these questions more quickly and with greater context.
At Mirai, we continue to enhance the extranet’s reporting area so that hotels can view, analyze and better understand key data regarding their direct sales.
We already had a solid base to analyze sales, bookings, pickup, markets, demand, and main commercial KPIs. Following the release of the new version of Mirai BI—which focuses on improving usability, customization, filters and navigation—we are now taking a new step: expanding the scope of the analysis with four new reports.
This update includes new layers of information on:
- Channel Mix: distribution, channels, costs and net contribution.
- Web Traffic / GA4: web demand, behavior and conversion.
- Paid Media: advertising spend, campaigns and business results.
- Metasearch Engines: performance, cost and price competitiveness.
The goal is not to add more dashboards, but to help you better understand what is happening and where to take action so you can sell more directly, with greater agility and higher profitability.

Channel Mix: Not all channels that sell bring the same value
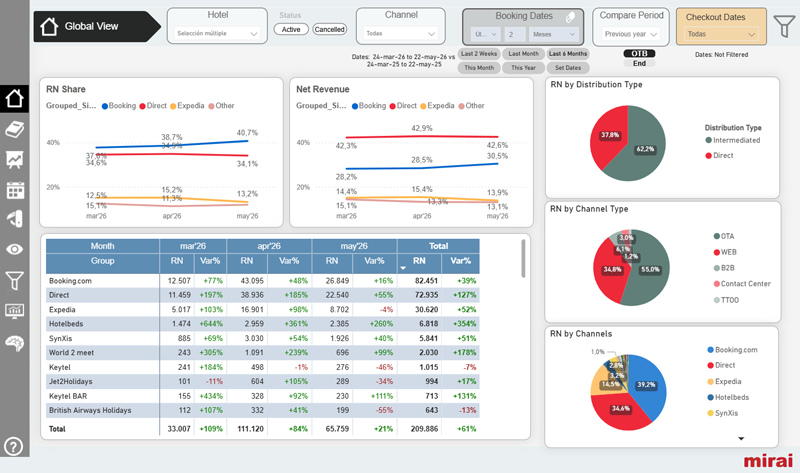
The Channel Mix report incorporates data from the channel manager to analyze direct sales within the hotel’s overall distribution context.
Its value stems from a simple but decisive idea: to truly understand distribution, you need to look beyond the surface. It is not enough to know how much each channel sells; it is also necessary to analyze its weight within the mix, how its pick-up is evolving, and what its actual contribution is once costs, commissions and intermediary fees are taken into account.
With Channel Mix, hotels go from simply asking themselves “how much am I selling per channel” to understanding how its main channels perform, the actual value each one generates, and the impact of shifting more distribution to the direct channel.
Main advantages
- Real Mix: understand the weight of each channel within the hotel’s distribution mix.
- Pick-up by Channel: analyze how booking generation is evolving across each channel.
- Key Channels: closely monitor the behavior of Booking.com, Expedia, direct bookings and other relevant channels.
- Net Contribution: analyze the value left by each channel after costs and commissions.
- Channel Cost: identify which channels generate revenue and which ones leave the most actual profit.
- On The Books: view future bookings and projected trends by channel.
- Direct Share: quantify the economic impact of shifting distribution towards direct sales.
- Strategic View: move from a channel-by-channel analysis to a comprehensive interpretation of the mix.
What you will be able to analyze
- Key KPIs: bookings, room nights, gross revenue, net revenue, commissions, channel cost, gross ADR, net ADR, etc…
- Analysis Periods: views by booking window and travel window.
- Trends: tracking of KPIs, monthly comparisons, and pick-up by channel.
- Segmentation: analysis by hotel, average stay, channel, and other available dimensions.
- Channel Types: OTA, website, B2B, tour operator, contact center, and other available channels.
- Channel Details: direct, Booking.com, Expedia and other specific channels, with a special focus on the main online channels.
- Net ADR: breakdown from retail price to final net ADR.
- Direct Simulation: estimation of additional revenue generated by shifting market share from third parties to direct sales.
Questions addressed
- Profitable distribution: how are my sales distributed? How is each channel performing? What is the actual profitability of each channel? And how much additional value can I generate by shifting demand towards direct sales?
Web Traffic / GA4: understanding demand before booking
The booking is the end result, but before reaching it, there are many signals that help us understand demand: how users arrive, what they do on the website, how they progress through the booking process, and at what point they drop out.
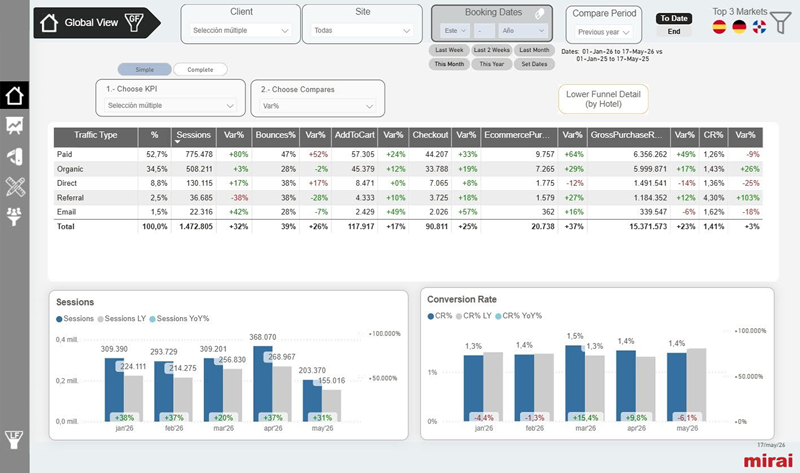
The Web Traffic / GA4 report, built on the integration with Google Analytics 4, allows you to analyze that previous phase with a more streamlined, aggregated view tailored to the hotel industry.
Google Analytics 4 provides a wealth of information, but it is not always easy to combine, interpret or translate that data into business decisions. The challenge becomes even greater when managing multiple hotels, several websites, different markets or numerous traffic sources. This report simplifies that data and connects it with the logic of direct sales.
Main advantages
- Web Demand: understand how demand reaches the hotel’s website.
- Funnel: identify friction points in the conversion process.
- Traffic Sources: compare the performance of different sources.
- Qualified Traffic: distinguish between visits with higher and lower commercial value.
- Hotel Insights: turn GA4 into a more useful business overview.
- Direct Conversion: move from isolated web metrics to concrete opportunities for improvement.
What you will be able to analyze
- Aggregation: one or more websites and one or more hotels from a single view.
- Web KPIs: sessions, bounce rate, web conversion rate, engine conversion rate, etc.
- Full Funnel: from web sessions to confirmed bookings.
- Loss of Demand: points where the user abandons the process before booking.
- Source/Medium: in-depth analysis of traffic origin.
- Traffic Type: Paid, Organic, Direct, Referral, Email, and others.
- Channel and Platform: analysis by qualitative groupings created by Mirai.
- Data cross-referencing: combination of GA4 with commercial information from the sales report.
Questions addressed
- Web conversion: what kind of traffic is coming to my website? Where does it come from? What is the conversion rate? And at what stage of the funnel can I make improvements?
Paid Media: advertising investment from a hotel industry perspective
Paid campaigns are usually analyzed on a per-platform basis: Google Ads, Microsoft Ads, Meta, TikTok, Pinterest, or other available channels. Each platform provides its own data, attribution models, and metrics.
But hotels need to look at things differently. It is not enough to know which campaign gets the most clicks, the best CTR or the lowest CPC. The important question is which investments actually contribute to the business results and what role they play within the direct sales strategy.
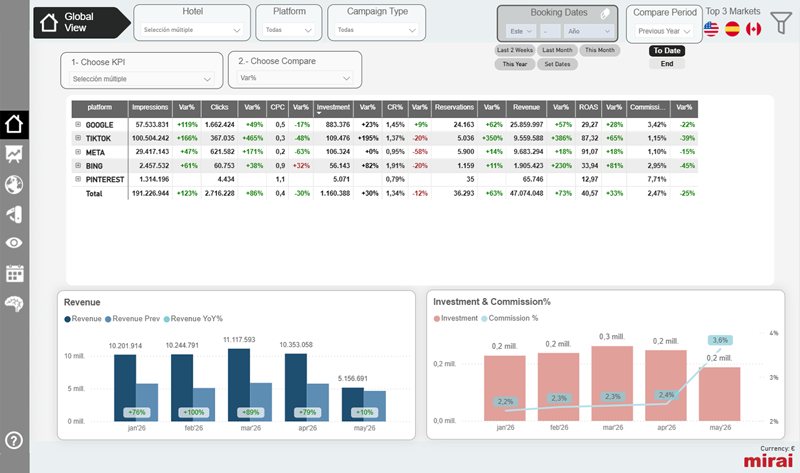
The Paid Media report gathers performance data of paid campaigns into a single platform, transforming scattered information into a unified, comparable and decision-oriented overview.
Main advantages
- Single View: gather advertising spend in one place.
- Real-world Comparison: compare platforms without relying on isolated data points.
- Direct Sales: link campaigns to business results.
- Full Funnel: understand the role each investment plays in the decision-making process.
- Prospecting: separate lead generation activities to measure them using appropriate criteria.
- Remarketing: distinguish campaigns targeting users who have already interacted with you.
- Hotel Profitability: view digital marketing from a business perspective, not just through platform metrics.
What you will be able to analyze
- Campaign KPIs: impressions, clicks, CTR, CPC, spend, conversion rate, bookings, revenue, ROAS, commission, etc.
- Platforms: Google Ads, Microsoft Ads/Bing, Meta, TikTok and Pinterest.
- Trends over time: trends, changes in performance, and deviations.
- Dimensions: hotel, market, platform, campaign and other available dimensions.
- Funnel Stages: upper funnel, middle funnel and lower funnel.
- Action Type: prospecting and remarketing.
- Campaign Type: qualitative groupings to better understand investment.
- Campaign Objective: sales, traffic, awareness, demand generation or other objectives.
- Custom Tables: analyses tailored to the most relevant metrics in each case.
Questions addressed
- Efficient Investment: how do my paid campaigns contribute to direct sales? What role does each part of the funnel play? And where should I optimize my investment to improve results?
Metasearch engines: visibility, profitability and competitiveness in the price showcase
Metasearch engines occupy a unique position in direct sales. They are not just a marketing channel: they are showcases where users compare prices, availability and booking options at a stage very close to the final decision.
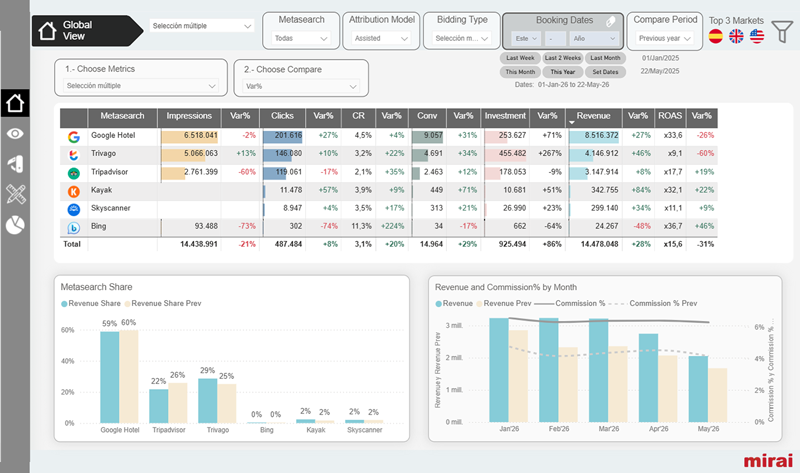
Therefore, analyzing them solely in terms of clicks or investment falls short. The Metasearch Report focuses its campaign analysis on platforms such as Google Hotel Ads, Tripadvisor, trivago, Kayak, Skyscanner, and Bing, combining three key metrics: performance, profitability and competitiveness.
Main advantages
- Meta Search: analyze all metasearch engines from a single, integrated vision.
- Profitability: compare performance, investment, cost and return by platform.
- Competitiveness: evaluate how direct pricing stacks up against other channels.
- Diagnostics: identify whether the problem lies with the campaign, the cost or competitiveness.
- Investment Model: break down results by CPA/CPS, CPC, or Free Booking Links.
What you will be able to analyze
- Performance KPIs: impressions, clicks, CTR, CPC, conversion rate, bookings, etc.
- Financial KPIs: investment, revenue, ROAS, cost, profitability, etc.
- Metasearch Engine: comparison across Google Hotel Ads, Tripadvisor, trivago, Kayak, Skyscanner, and Bing.
- Trend: tracking of key indicators over time.
- Attribution: assisted or click-based model.
- Investment: CPA, CPS, CPC and Free Booking Links.
- Price Competitiveness: meet, beat and lose metrics.
- Direct Channel Position: analysis of whether the direct channel appears in parity, with a better price or at a disadvantage compared to other channels.
Questions addressed
- Direct Competitiveness: what role do metasearch engines play in my direct sales? How can I improve their profitability? And how competitive am I when customers compare prices?
From scattered data to clearer decisions
Direct sales do not depend on a single metric. They depend on how distribution, demand, investment and competitiveness come together.
The channel manager tells one part of the story. Google Analytics 4 tells another. Advertising platforms provide their own insight. Metasearch engines add information on performance, visibility and price competitiveness. And booking data explains the final result.
When viewed in isolation, each data source leaves questions unanswered. The difference lies in connecting those sources, translating them into the language of the hotel industry, and turning them into a clear reading to improve decision-making.
With this development, the Mirai Reports area helps the hotel identify opportunities sooner, better prioritize its efforts, and move towards a more efficient, more profitable distribution that is less reliant on intermediaries.
If you want to access any of these reports or understand which one best suits your needs, speak to your Account Manager. They will help you review which reports are available for your hotel, which connections are active, and how to get the most out of each view.
New features of our BI tool:
- Booking source and medium are now available in your BI reports
- The most comprehensive upselling reports available in BI
- New web demand report in our BI.
- Possibility to compare vs 2021, 2020 or 2019
- Price competitiveness in Hotel Ads.
- Reporting of all your marketing investments (Ads and Metasearch).
- Benchmark of similar customers.
- Type of stay, occupancy, club, etc. as well as data analysis: general situation of your hotel, on the books (OTB), Pickup, Markets.
- Mirai BI collects the information from Mirai Rescue: Wait List, Cart Recovery and Retargeting